Businesses today spend a lot of money on BI dashboards, analytics tools, and reporting platforms. The idea is simple: more tools should mean better insights. But although the tools are powerful, many teams still struggle every day because the numbers don’t always feel right.
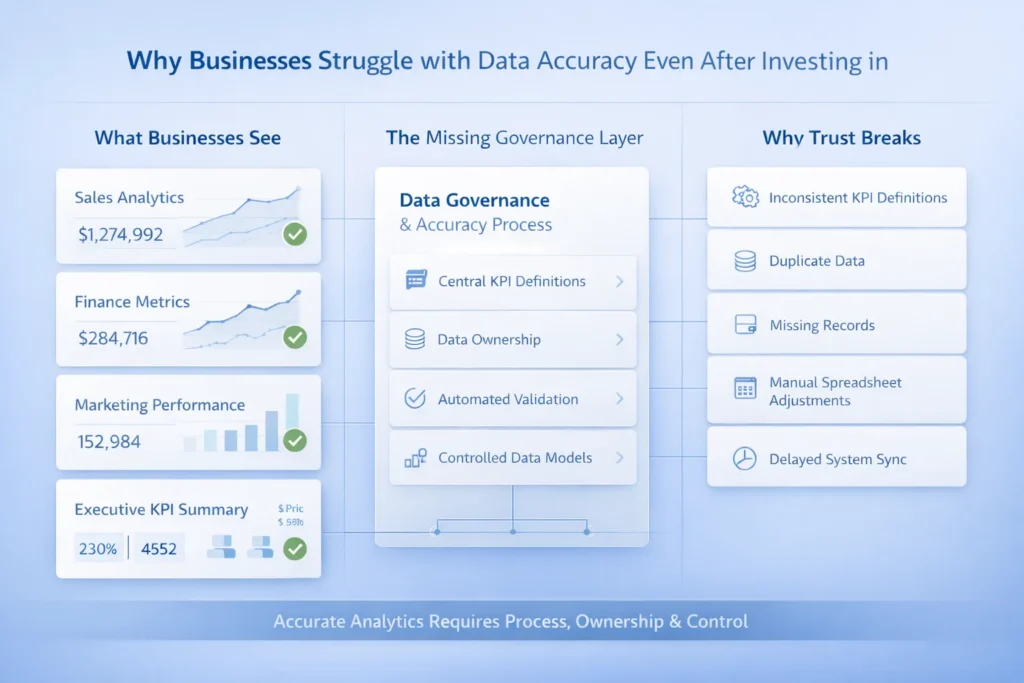
Despite heavy investment, it’s common for people not to trust reports. Sales sees one number, finance sees another, and marketing sees something else. Because of this confusion, meetings turn into debates instead of decisions. Consequently, choices are postponed because no one has complete faith in the data available at the time of making a decision.
This problem is not really about having the wrong tools. It is about data accuracy issues. Tools can only show what they are given and if the data going in is messy, incomplete, or inconsistent, the output will be unreliable too. Hence, the reason more analytics does not automatically mean more clarity. Without accurate data, even the best tools fail to build trust.
Modern analytics tools look clean, colorful, and very professional. Dashboards load fast, charts move smoothly, and numbers appear precise. But although everything looks polished on the surface, many hidden problems sit underneath the data.
A good-looking chart does not guarantee the data will be accurate. Visualization helps individuals to have a better grasp of numeric information, but it cannot fix bad inputs. If the source data is wrong or incomplete, the dashboard will still display it nicely. Thus, teams may trust reports simply because they look advanced, even though the data is flawed.
These tools also make problems spread faster. Since data flows quickly across systems, unreliable analytics data can reach many teams at once. As a result, inaccurate business reports get shared, discussed, and acted on before anyone notices the mistake. Hence, modern tools can amplify bad data instead of fixing it.
One major data accuracy issue is inconsistent data definitions. Different teams often have a different way of defining same metrics. Although each report seems correct, the numbers do not match.
Duplicate and missing records are another problem. Since data comes from many systems, records can be repeated as well as lost. Because of this, totals change and trust in reports drops.
There are also errors caused by manual data entry. People make mistakes, and even minor typing mistakes can affect big reports. Thus, data quality problems in analytics often begin at the source.
Delayed or partial data refreshes create more confusion. Some reports update late or fail silently. Therefore, teams see opposing numbers on dashboards and can hardly make any definite decision.
Analytics tools are built with one big assumption: the data going in is already clean and organized. They are great at showing trends, but they do not fix broken data. Because of this, problems often stay hidden behind nice charts.
The old rule still applies here: garbage in, garbage out. If the source data is messy, the output will be messy too, even though it looks professional. Thus, analytics data quality depends more on inputs than on the tool itself.
Another issue is the lack of checks before data enters the system. Since there is little upstream validation, errors pass through quietly. Although self-service analytics gives teams freedom, over-reliance on it can spread bad data faster. Hence, tools alone cannot solve data quality problems.
Many businesses use data from many different systems. Sales, finance, and marketing often store data separately. And since these systems are not fully connected, numbers are pulled without proper checks. Because of this, inaccurate business reports become very common.
Data is often moved using spreadsheets. Although spreadsheets are easy to use, they are risky as well. Files get copied, renamed, or edited, and small changes go unnoticed. Thus, unreliable analytics data spreads quickly.
Manual joins and transformations add more errors. People combine tables by hand and apply quick fixes to meet deadlines. Hence, mistakes slip in easily. On top of that, version control issues make things even worse. Different teams work on different files, and none of them can tell which report is the latest or correct one.
People play a big role in data problems, even though it often goes unnoticed. Different teams interpret the same metric in different ways. Although everyone thinks they are right, the numbers no longer line up, hurting data accuracy in business intelligence.
Another issue is unclear ownership. No one knows who is responsible for certain data fields. Because of this, errors stay unfixed or get passed around between teams.
Last-minute manual overrides also cause significant issues. To meet deadlines, numbers are changed without full checks, leading to errors in reports. Further aggravating the situation is the knowledge gap existing between business users and analytics teams. Since both sides speak different “data languages,” issues stay hidden until decisions are already made.
As a business grows, it starts using more tools and systems. Sales, support, finance, and marketing all add their own platforms. Since these systems are harder to connect, data accuracy issues increase with complexity.
Reports are also created more often. Daily and real-time dashboards leave less time to check numbers. Because of this, small errors show up faster and spread wider across teams.
Businesses also need to make decisions more quickly as they grow. Although speed is important, it magnifies the impact of bad data. Hence, when inaccurate data is used at scale, even small mistakes can lead to big problems.
Improving data accuracy in business intelligence starts with defining and documenting KPIs centrally. When everyone uses the same definitions, reports become more consistent as well as confusion is reduced.
Next, establish clear data ownership. Assigning responsibility for each dataset ensures errors are caught and fixed quickly. Errors in datasets often go unnoticed and spread across systems because no one is assigned or given the ownership.
Automating validation and reconciliation is another key step. Tools can check data for duplicates, missing values as well as inconsistencies faster than humans. This decreases the reliance on manual checks and minimizes the possibility of errors.
Try to reduce spreadsheet dependencies. Moving data manually between files introduces errors, so centralizing data helps keep it clean. Lastly, build governed data models that enforce rules and standard structures. This makes dashboards and reports credible and dependable since everyone is working on same and precise data.
Trustworthy analytics starts when data accuracy is treated as an ongoing process, not a one-time task. Teams continuously check, validate, and correct data instead of hoping it’s right.
Feedback loops between users and data teams help catch errors early. When people report inconsistencies, data teams can fix them before they spread. Monitoring and alerts also make sure problems are spotted quickly, allowing continuous improvement.
BI dashboards play an indirect role by showing trends and anomalies. Although they don’t fix bad data themselves, they highlight areas where unreliable analytics data might exist. This makes it easier to act before small errors become big problems.
Tools help you see data, but they do not make it accurate on their own. Data accuracy issues are solved through clear processes, ownership, and disciplined practices. Businesses that treat data like infrastructure, not just numbers, build trust and make smarter decisions every time.