Is your Power BI dashboard crawling? When datasets grow into the millions of rows, performance often takes a hit. Slow load times, lagging visuals, and spinning refresh icons aren’t just frustrating they hinder fast, data-driven decision making.
Optimizing Power BI performance for large datasets is essential for maintaining a professional reporting environment. By streamlining your data model and refining your calculations, you can transform a sluggish report into a high performance analytics tool.
If your reports are struggling to keep up with your data growth, our Business Intelligence & Analytics Services are designed to audit and resolve.
Power BI primarily operates using an in memory engine (VertiPaq). When you load massive volumes of data, the system consumes more RAM and CPU to compress, store, and query that information.
If you are experiencing these lag issues right now, our deep dive on Power BI dashboard slow performance covers specific troubleshooting steps to identify the root cause.
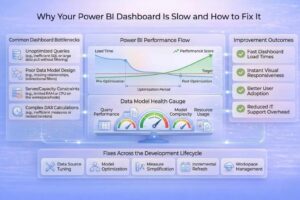
Slow loading is one of the first signs of weak power bi performance, because dashboards take too long to open and users have to wait before they can even start working.
When charts and graphs respond slowly, it means the dashboard is struggling with power bi large data. This affects interaction and makes analysis less effective.
When filters are slow in updating the results, it is an indication that the system is straining. This has a direct impact on the dashboard speed and slow reporting.
When data refresh takes longer than usual time, it indicates performance issue. This can reduce overall power bi performance optimization and can also delay access to updated reports.
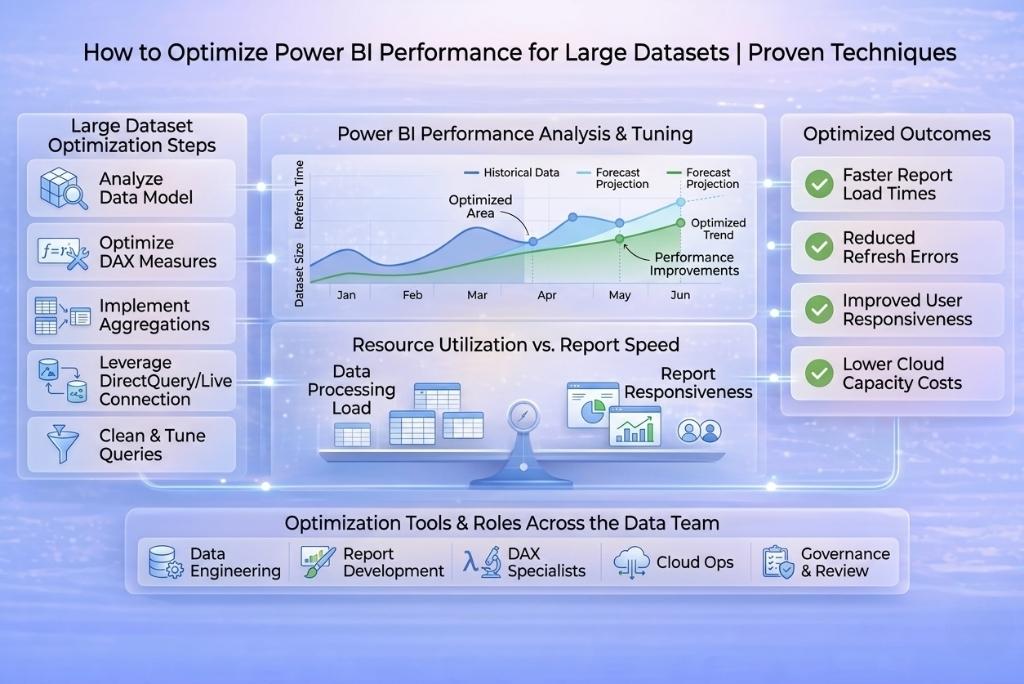
Improving power bi performance becomes very important when working with large datasets, because slow reports can affect decision-making. Following techniques help in reducing load time, improving dashboard speed as well as making reports smoother even when handling power bi large data.
The most effective way to speed up Power BI is to load less data.
Avoid using one giant “flat” table. Instead, organize your data into Fact tables (quantitative data like sales) and Dimension tables (descriptive data like products or customers). A Star Schema reduces the complexity of relationships and significantly boosts query speed.
You can summarize large datasets into smaller tables. This reduces the amount of data being processed and improves dashboard speed.
You should use variables and avoid complex nested formulas. Simple calculations improve power bi performance optimization and reduce processing time.
Import mode is faster because data is stored in memory. Thus, it improves overall performance compared to live connections.
You should load only new or updated data instead of refreshing the full dataset. This is very useful for power bi large data and saves time.
You should reduce unnecessary steps and clean data early in the process. This makes data loading more efficient and improves performance.
You should keep only 5–8 visuals per page because too many visuals slow down dashboard speed and make reports heavy.
This tool helps you find slow visuals in your report. Once identified, you can fix them to improve power bi performance.
You should avoid many-to-many relationships because they increase complexity. Simpler relationships improve processing speed and overall efficiency.
When working with power bi large data, basic fixes are not always enough. You also need advanced methods because they help improve power bi performance at a deeper level and make dashboards much more stable and fast.
Data partitioning means splitting large datasets into smaller parts. This helps reduce processing load because Power BI does not need to scan the full dataset every time, thus improving dashboard speed and performance.
Composite models allow you to combine Import and DirectQuery in one report. This is useful because you can store some data in memory while still connecting live to other sources, thereby improving flexibility and power bi performance optimization.
Indexing helps Power BI find data faster by creating efficient data paths. When correctly defined, queries run faster, and overall power bi performance improves, particularly with large, complex datasets.
Many users load the entire dataset even when it is not needed. This increases processing time and reduces power bi performance, especially when working with power bi large data.
Some people do not focus on how their data model is structured. A poor design slows down queries and affects overall power bi performance optimization, making reports less efficient.
Adding too many charts and graphs may look useful, but it actually slows down dashboard speed. It makes reports heavy and harder to interact with.
Optimization is not a one time task; it is an ongoing process as your business data grows. By applying these 10 techniques, you can ensure your Power BI environment remains agile, responsive, and reliable.
Stop struggling with laggy reports and start making faster decisions. Contact Data Inseyets today for a performance audit and custom dashboard solutions built for scale.