Slow dashboards can quickly frustrate teams because no one really likes waiting for data to load. You open a report expecting quick insights, but in turn, it takes too long, and that delay breaks your focus. It also slows down decision-making, which can be a real problem in fast-moving work environments. This is often a sign of power bi slow performance, which many users face at some point.
Power BI is a powerful tool, but it can still feel slow if the reports are not designed properly. Reports may take time to load because of large datasets, too many visuals, or inefficient calculations. Although this sounds a bit technical, the fixes are usually simple and practical. Continue reading to learn what causes these slowdowns and how to fix them quickly, so you can speed up your reports and make them run smoothly.
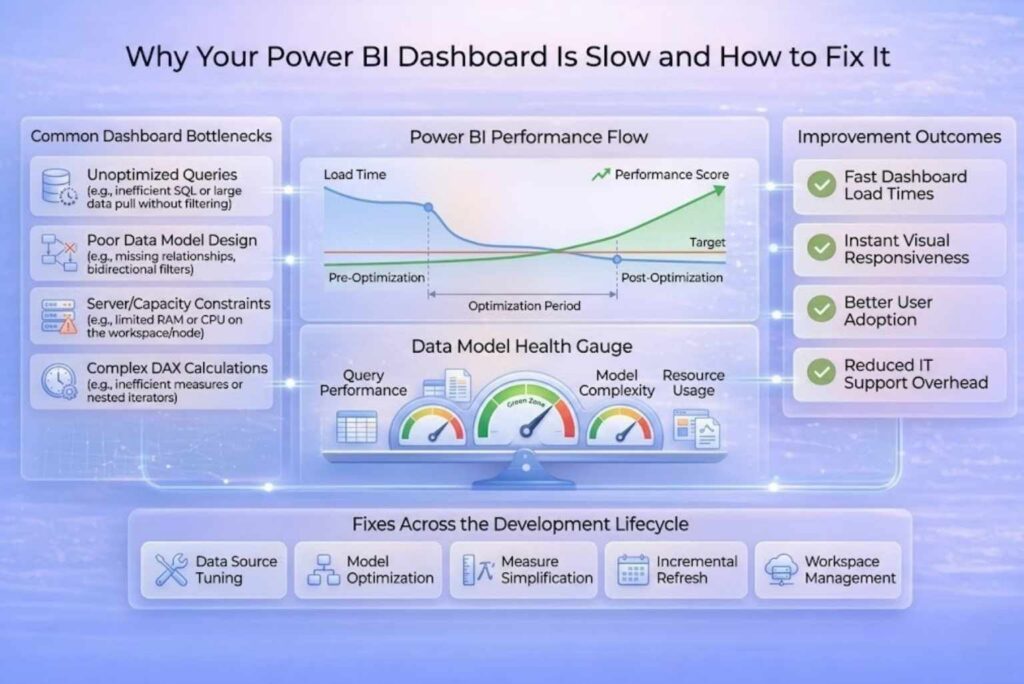
When your reports start lagging, the signs are usually easy to notice. You may ignore them at first, but they clearly point to power bi performance issues that need attention.
Your report takes too long to open, which can be very frustrating. This usually happens because the dataset is large or the model is not optimized. As a result, users end up waiting instead of analyzing data.
Charts and tables do not load instantly, but instead appear one by one with a delay. This happens because visuals are too heavy or there are just too many of them on a single page. Although each visual may seem small, together they slow everything down.
Filters and slicers respond slowly when you click them, which affects the user experience. This happens because Power BI has to process multiple queries in the background. Thus, even simple interactions start to feel sluggish.
Data refresh takes more time than expected, especially with large or complex datasets. This can happen because of inefficient queries or unnecessary data being loaded. Hence, it delays updates and reduces the reliability of your reports.
There are many reasons why a power bi dashboard slow issue happens. Most of them are easy to spot once you know where to look. If you understand the cause, you can also optimize power bi dashboard performance much faster.
Many reports load more data than needed. This includes extra columns and rows that are never used. Because of this, the file becomes heavy and slow to process.
Insight: Bigger data means slower performance. Thus, reducing data size can quickly improve speed and help speed up power bi report loading.
A weak data model can create serious power bi performance issues. Sometimes there are no proper relationships between tables. Other times, everything is kept in one flat table.
If you want to improve your data model further, read our guide on how to create a calendar table in Power BI.
Some dashboards try to show everything at once. This leads to too many charts, tables, and cards on a single page.
Each visual needs time to load. So when there are too many, the whole report becomes slow.
DAX formulas control many calculations in Power BI. If they are too complex, they take more time to run.
Because of this, visuals load slowly and interactions feel delayed. Simple and optimized formulas can reduce this problem.
DirectQuery pulls data from the source in real time. This sounds useful, but it can slow things down.
Each action sends a query to the database. If the source is slow, your report will also be slow.
Some reports use detailed data when it is not needed. This means Power BI processes more information than required.
If you use summarized data instead, performance improves. Hence, aggregation helps reduce load and improves speed.
Power Query is used to clean and shape data. But heavy transformations can slow down loading time.
Steps that are not needed should be removed.
Since every step adds processing time, fewer steps mean faster performance.
If you are facing power bi slow performance, the good news is that you can fix it with a few smart steps. These methods are simple but effective. They will help you optimize power bi dashboard speed and also speed up power bi reportperformance without much effort.
To begin, you need to reduce the data you load. Remove columns and rows that you do not use. Doing this will help make the model lighter and faster. Less data means quicker processing. Hence, your report loads faster and feels smoother.
A star schema keeps your data model clean and simple as well. It uses clear relationships between fact and dimension tables.
This structure helps Power BI run queries faster and because of this, you will see fewer power bi performance issues.
Too many visuals will slow down the entire experience. Each chart needs time to load and refresh.
Best practice:
This is an easy way to fix a power bi dashboard slow problem.
DAX formulas should be simple and efficient. Complex logic slows down calculations.
Thus, your visuals will not only respond faster but also more smoothly.
Import mode stores data inside Power BI. This makes data access much faster.
DirectQuery can be slow because it depends on the source. So, use import mode when real-time data is not required.
You can use summary tables rather than using detailed data when reporting.
Aggregated data reduces the load. Hence, it helps improve performance and speeds up reports.
Refreshing all data every time can take too long. Incremental refresh only updates new or changed data.
This saves time and improves efficiency. It is very useful for large datasets.
Power Query should be clean and simple. Too many steps increase load time.
Since each step adds processing time, fewer steps make reports faster.
Power BI has a built-in Performance Analyzer tool. It helps you find slow visuals and queries.
You can see what is taking time and fix it as well. This makes it easier to solve power bi slow performance issues quickly.
If you need expert support to optimize enterprise dashboards, our Business Intelligence & Analytics Services can help improve report speed, usability, and decision-making performance.
Use this quick checklist to fix power bi slow performance without overthinking it. These are simple steps, but they make a big difference.
These quick actions can help you optimize power bi dashboard speed and also speed up power bi report performance.
Power BI performance is not just about speed. It is also about usability. A report that takes too long to load will frustrate users. A report that loads quickly allows users to make decisions with speed and confidence. That’s why it’s so important to fix Power BI slow performance issues if you want your dashboards to be useful to your audience.
When you optimize power bi dashboard design and remove common issues, everything becomes smoother. Reports load faster, visuals respond better, and users trust the data more. Overall, the better your dashboards perform, the better the results you get.
Need help optimizing your Power BI dashboards? Visit Data Inseyets to explore data solutions, reporting services, and performance optimization support tailored for your business.