Many businesses today pull data from many places (ERP systems, CRM systems, spreadsheets, API’s and other applications), which often store dates differently and the level of detail (day, week, month) can vary a lot.
Without a shared timeline, reports start to break. Totals don’t match, trends look wrong, and teams spend more time fixing numbers than making decisions. This is where a Power BI calendar table becomes essential.
A calendar table acts as a single source of truth for dates. It aligns all data from multiple systems, making reporting consistent and reliable. With it, time-based analysis finally makes sense across the whole business.
A date table in Power BI is simply a table that lists all the dates your business cares about. It can include extra info like year, month, quarter, day of the week, or even holidays. This table helps your reports understand time in a consistent way.
Power BI has an auto date/time feature, but it’s limited. It creates hidden tables for each date column, which work for simple reports but fail for complex multi-source models. A Power BI date dimension gives you full control and works reliably across all tables.
A proper date table is needed for Power BI’s time intelligence functions, like YTD, MTD, comparisons, or moving averages. Without it, calculations may be wrong, totals may not match, and trends can look confusing. In short, a date table is the backbone of any trustworthy time-based analysis.
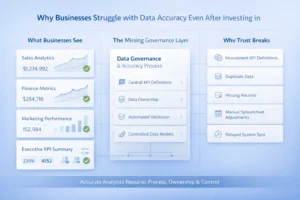
When businesses pull data from multiple sources, each system often has its own date formats and fields. Sales might use order date, finance uses invoice date, and operations tracks shipment date. Without a shared timeline, there is no way to align these dates properly.
This lack of a common calendar leads to problems. Totals can be wrong when filtering by month or year, and comparing data across systems becomes confusing or nearly impossible. That is why a Power BI calendar table for multiple data sources is so important; it ensures all data speaks the same “time language” and avoids broken reports.
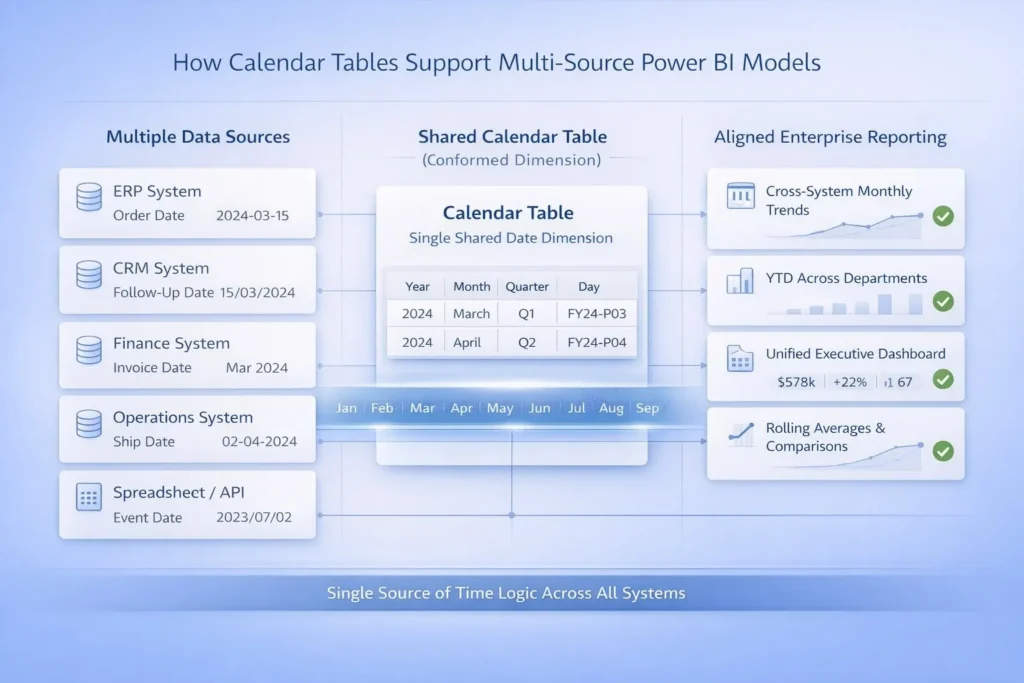
A calendar table Power BI is a single date table that connects to all your fact tables. This is a simple example of the conformed dimensions concept: one consistent dimension (dates) shared across many datasets.
For example, your sales system, finance system, and operations system can all use the same calendar table. This makes it easier and more accurate to filter, slice, and compare data across systems. Using a Power BI date dimension ensures totals match, trends make sense and reports remain reliable no matter how many sources you combine.
DAX Power BI time intelligence functions rely on a properly marked Power BI calendar table to work correctly. Without it, calculations can give wrong or inconsistent results.
For example, Year-to-Date (YTD), month-over-month, year-over-year, and rolling averages all depend on a clean, consistent date table. If the table is missing or incomplete, totals may be wrong, comparisons fail, and trends become confusing. Using a calendar table ensures accuracy and consistency in all time-based calculations. It acts as the backbone for any reliable time intelligence in Power BI.
Many reporting situations need a Power BI calendar table for multiple data sources. For example, combining ERP and CRM data and/or linking task data with financial data works best when everything shares the same timeline.
Operational logs and reporting spreadsheets also need to line up so totals don’t get mismatched. Executive dashboards that cover multiple departments rely on one calendar table to keep numbers consistent across teams. In short, any analysis that pulls from different systems becomes much easier as well as much more reliable when all data uses a single calendar table.
Always use one shared Power BI calendar table for your model. And don’t create separate date tables for each data source, because that can lead to totals that don’t match.
Make sure to mark the table as a Date Table in Power BI so all time-based functions work properly. Take care of missing dates so your reports don’t show blanks, and use inactive relationships when you need to connect fact tables without causing problems.
Following these steps keeps your model reliable, easier to manage, and also makes your reports much more trustworthy.
Relying on auto date/time is a common mistake. It can create hidden tables that don’t work well in complex models.
Using multiple calendar tables in one model or not covering the full date range across all sources also causes errors. Incorrect relationships or cardinality, and mixing datetime with date fields, are other frequent issues. A clean data table in Power BI is essential for correct Power BI time intelligence.
A Power BI calendar table makes DAX formulas much simpler because all calculations can use the same central table. With fewer repeated formulas, your reports run faster and smoother as well.
It also makes fixing problems easier. If something goes wrong, you know exactly where to check. Also, on top of that, when you add new data sources, one calendar table handles them easily. This keeps your model clean, organized as well as easy to maintain over time.
Sometimes a generic calendar table isn’t enough. Custom calendars are needed for fiscal years, 4-4-5 accounting periods, regional holidays, or other business-specific reporting periods.
A Power BI date dimension can be adjusted to match these requirements. Customizing the calendar ensures that your reports reflect real business logic rather than just standard calendar dates.
A Power BI calendar table is not optional in multi-source models. It ensures your data is accurate, consistent as well as trusted across teams.
If you want scalable, enterprise-grade reporting, a strong calendar table is the foundation for the same. Without it, time-based analysis is unreliable and hard to manage.