Many businesses are finding it difficult to keep up with the demands of their business. Some teams are overworked and stressed, while others sit with unused capacity. A constant, steady flow of work does not always happen; therefore, if there isn’t enough time for planning, things quickly become uneven.
When companies rely on reactive planning, problems follow. Teams rush to meet deadlines, burnout increases and mistakes do happen. Costs also rise because businesses may hire in a hurry or pay overtime, although better planning could have prevented it.
This is why workload forecasting has become so important. It is not about guessing what might happen, but about using real planning data to see what is coming next. Since businesses already collect useful data, they can use it wisely to plan ahead, balance capacity as well as make smarter decisions.
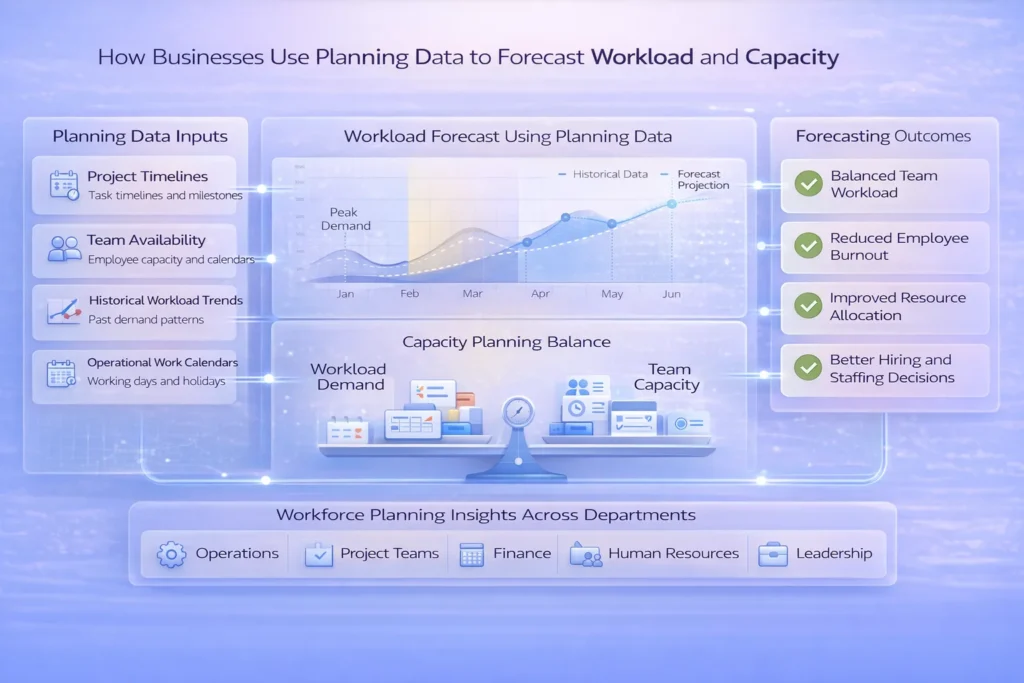
Planning data is the information businesses use to decide who will do what and when. It includes task schedules, project timelines, team availability, work calendars, and even past workload trends. In simple terms, it shows how work is expected to flow through the business.
There is a difference between regular data and planning data. Operational planning data shows what is happening right now, such as tasks that are in progress. But capacity planning data focuses on what is coming next and whether the team can handle it. So while reports look at the past, planning data helps prepare for the future.
Planning data is critical for workload forecasting. It is not only about tracking past performance, but also about predicting demand and making adjustments early. Since businesses want fewer surprises, they need a source of information to use for planning purposes, not just for reviewing historical data.
Many companies still manage workload and capacity analysis using spreadsheets or other disconnected tools. Although this may work at a small scale, it becomes messy as projects grow. Files get outdated, numbers do not match, and people waste time updating the same data over and over again.
Manual systems also lack real-time visibility. Managers often plan based on assumptions instead of real evidence, because the data is not updated instantly. As a result, forecasting workload demand becomes more of a guess than a strategy.
This approach fails as businesses scale. More projects mean more complexity, but manual planning cannot keep up. Thus, teams either become overloaded or sit idle, which affects productivity, costs, and overall performance.
Planning data helps businesses see patterns in their past work. By looking at previous trends, companies understand when they were busy and when things were slow. This makes workload forecasting more reliable because it is based on real history as opposed to speculation.
It also shows seasonal peaks. Some months are always heavier, although teams may forget this without data. Since these patterns repeat, businesses can prepare early.
Structured data like task dates, effort, and dependencies also matters. It shows how long work takes and how tasks connect. Thus, business forecasting models can compare workload with available capacity and prevent overload.
Capacity planning for businesses means matching workload with available people, time, and skills. It is about making sure demand does not exceed supply. Although simple in idea, it needs accurate capacity planning data.
And with the right data, managers can see who is overloaded and who has free time. They can also find underused capacity, which often goes unnoticed in manual systems.
Since decisions are based on facts, businesses know when to hire, shift work, or adjust deadlines. This reduces stress, controls costs as well as improves performance.
Workforce planning analytics connects people, time, and work in one clear view. Instead of just looking at schedules, businesses can use data to understand how work flows across teams. This helps them see not only what is planned, but also what might happen next.
It also allows forecasting resource demand by role or team. For example, a company may see that developers will be overloaded next quarter, although designers still have capacity. Since the data is structured, managers can plan early and avoid last-minute stress.
Another big benefit is scenario analysis. What happens if demand increases? What if a project gets delayed? Using data for resource planning makes it easier to test different situations. Thus, leaders get executive-level visibility into future workload risks and can act before problems grow.
Businesses use several operational forecasting techniques to plan ahead. One common method is trend-based forecasting, where past patterns help predict future demand. Although simple, it works well when workload follows clear trends.
Rolling forecasts are also very popular. Instead of planning once a year, companies update forecasts regularly. This keeps plans flexible because business conditions often change.
Scenario and “what-if” analysis helps teams prepare for uncertainty. Calendar-driven forecasting is also important, since working days, holidays and project phases directly affect capacity. Structured calendar data supports better planning data for business growth, thereby making forecasts more realistic as well as more practical.
Workload and capacity analysis is useful in many industries. In project-driven teams like IT, consulting, or marketing agencies, managers need to know if they have enough people for upcoming projects. And since deadlines are tight, forecasting helps avoid last-minute hiring and/or burnout.
Operations and service teams also depend on forecasting workload demand. For example, customer support teams must prepare for busy seasons. Although demand may change, planning ahead reduces stress and improves service quality.
Finance and leadership teams use forecasting to decide when to hire and when to slow down. By comparing future demand with team capacity, they can control growth. Thus, businesses face fewer surprises, make better decisions, and grow in a stable way.
Raw planning data alone is not enough. It needs analytics to turn numbers into clear insights. Since data can be complex, visual dashboards help teams understand trends and future workload quickly.
Analytics tools show workload forecasting in charts and timelines. They highlight peaks, gaps, and risks, thereby making it easier to act early. Calendar-driven models and time intelligence also improve accuracy because they consider working days, holidays, and project phases. A well-structured Power BI Calendar Table is the foundation for this — it enables accurate time intelligence by mapping dates to fiscal periods, public holidays, and working days across your reports.
Real-time visibility is a big advantage. Static reports become outdated fast, but live dashboards show what is changing right now. This makes workload forecasting more reliable and practical for daily decisions.
One common mistake is ignoring calendar logic. Many companies do not take into consideration/ forget to adjust for holidays or fewer working days. This has a direct impact on the ability to meet that demand.
Another issue is forecasting without a historical context. Without past data, forecasting workload demand becomes guesswork. Since patterns often repeat over time, ignoring historical data leads to poor predictions.
Some businesses also overload teams because they lack visibility. Others treat planning as a one-time task, but forecasting should be ongoing. Thus, mistakes happen when planning is not updated regularly.
Planning data helps businesses move from reactive to proactive decisions. Instead of responding to problems, they prepare in advance.
Accurate workload forecasting supports balanced teams and steady growth. When workload and capacity are aligned, stress decreases and productivity improves.
Businesses that forecast well scale with confidence. Since they rely on structured planning data and strong analytics, they can grow without chaos and stay ahead of competitors.