Managing projects can be challenging enough; you don’t need to be wasting hours chasing updates or simply trying to figure out where things stand.
If you’re still tracking your work using Excel, through email, or Sticky Notes, you should know that there is a better way to stay on top of tasks, people, and progress.
The Microsoft Planner Power BI Dashboard makes it easy to convert your Microsoft Planner tasks into clear, live dashboards that display your work clearly and accurately without having to be a technology expert or data analyst.
This guide will cover how Power BI can help with project reporting. You will learn how it helps save time, reduce errors, and make faster, smarter decisions.
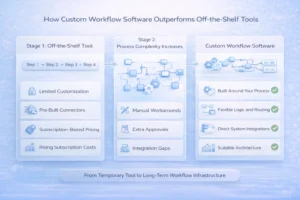
Why Traditional Project Reporting Falls Short
To be honest, most traditional tools for tracking projects just don’t cut it anymore. Here are some common problems teams face:
If any of this sounds familiar, you’re not alone and Power BI can help.
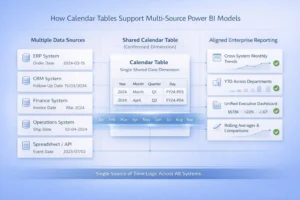
Power BI is a tool from Microsoft that helps you turn your project data into clear visuals like charts and dashboards.
It pulls information from tools like:
Power BI brings all this information together in one place. You can then see updates in real-time and share reports with your team, your boss, or anyone else who needs to know what’s going on.
The best part? You don’t need to write code or be a data expert. It’s built for everyday users.
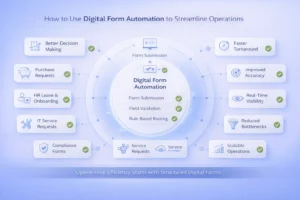
Here’s how Power BI can make your life easier as a manager or team lead:
Microsoft Planner is great for tracking tasks, but it has limits when it comes to reporting.
That’s where Power BI + automation comes in.
You can use a special setup that automatically sends all your Planner task data into Power BI. This means you get live dashboards showing:
And more!
No extra work.
No technical setup needed.
This solution uses Power Automate, a Microsoft tool that connects apps together. Here’s how it works:
You don’t have to click “refresh” or manually update anything. The system does it all for you.
Here are some of the best features of using Power BI with Planner:
Everything updates on its own. You can save 50+ hours of manual work each year.
Dashboards update automatically as your team changes tasks. You always see the latest info.
Share dashboards with your team in SharePoint or Microsoft Teams. Everyone stays on the same page.
It uses Microsoft’s standard tools, so your data is protected. No need to buy extra licenses.
You can add new reports, customize the visuals, or expand to other tools as your needs grow.
This reporting system includes everything you need to get started right away:
It’s perfect for:
View everything from one place: project timelines, task status, overdue items, and more.
You don’t need to build reports from scratch or chase team members for updates.
See which tasks or projects are falling behind so you can take action fast.
Use real data (not guesses) to plan projects, assign resources, and manage deadlines.
Whether you’re reporting to your boss or leading a team, Power BI keeps everyone on the same page.
If you’re managing projects with Microsoft Planner, adding Power BI can make your life so much easier.
At Data Inseyets, we help you bring Microsoft Planner and Power BI together seamlessly. Whether you’re a manager, team lead, or consultant, this simple setup can help you take control of your project reporting.
© 2025, Data Inseyets-All Rights Reserved.