These days, most organisations have KPI dashboards or business intelligence dashboards. They’re meant to help teams make faster and smarter decisions. But surprisingly, decisions often still happen outside these dashboards. People rely on old spreadsheets or “shadow reports” because they don’t fully trust what the dashboard shows.
Dashboards fail not because the tools themselves are bad, but because the KPIs and data they display are poorly designed. If teams can’t understand or rely on the numbers, they’ll ignore the dashboard altogether. Although a dashboard looks polished, it’s useless if it doesn’t answer the real questions teams have.
A cycle is established by the lack of trust: teams bypass dashboards, duplicate work in spreadsheets, and make decisions that do not align with the official data. Therefore, building dashboards that people actually trust goes beyond the software. It’s about designing KPIs that are clear, relevant, and actionable.
Many dashboards fail because they try to show too much at once. Teams get overwhelmed with numbers, charts, and metrics, and the main focus is lost. KPI reporting should highlight what really matters, but too often it doesn’t.
Another common problem is that KPIs are disconnected from real business decisions. Although the data might look accurate, it doesn’t help leaders or teams take action. This is one of the main reasons dashboards fail: they measure the wrong things.
Inconsistent definitions across teams also create confusion. One department might calculate a metric differently from another, thereby making the dashboard unreliable. The situation is further complicated by data quality issues and delays in updates that make the problem worse, since outdated or incorrect numbers destroy trust.
Additionally, most dashboards are created with analysts in mind rather than operators or leaders. While they show more detailed information, they may not provide sufficient information for decision-making. As a result, while many teams have dashboards, most do not use them.
A lot of teams confuse KPIs and metrics. KPIs are key performance indicators—they measure what really matters for business goals. Metrics, on the other hand, are numbers that track day-to-day activities. Knowing the KPI vs metrics difference is the first step to building dashboards that people trust.
Not everything measurable should be a KPI. Although a metric might be easy to track, it doesn’t mean it drives important decisions. KPIs should focus on outcomes, not just activity.
For example, website page views or email opens are metrics, but they aren’t KPIs unless they directly impact revenue or conversions. Similarly, the number of support tickets is a metric, but the resolution rate might be a KPI because it affects customer satisfaction.
Understanding how to define meaningful KPIs ensures your dashboard shows the numbers that truly matter, rather than just flooding teams with data they can’t act on.
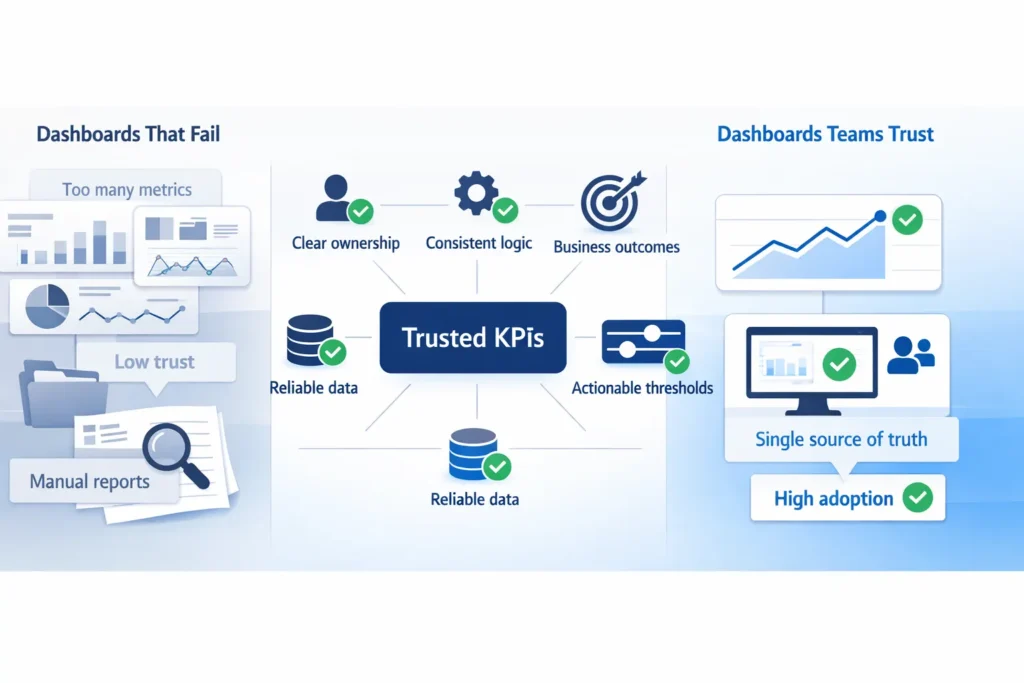
To be effective, a KPI must link directly to business outcomes, so teams understand how the number affects goals, revenue, or performance. This direct connection builds confidence in the data.
Clear ownership and accountability are also important. If someone has the responsibility for managing a KPI, they are likely to spend time reviewing and updating to ensure it is accurate. Everyone knows who to ask if there’s a question.
Consistent calculation logic matters a lot. If different teams calculate the same KPI differently, trust disappears. Standardising how KPIs are measured keeps the numbers reliable.
Timely and reliable data sources make a big difference. KPIs based on outdated or incomplete data won’t help teams make the right decisions. In order to stay relevant, dashboards need fresh data regularly.
Finally, KPIs must also be actionable. If a KPI does not point to an action/ suggest a next step or decision, it is of no value to teams. Good KPI development focuses on metrics that guide action, not just measure activity.
These steps will help you create KPIs that guide decisions, help improve performance, and also demonstrate to teams what is important. This is key to how to define meaningful KPIs that people actually trust and use.
Dashboards should be designed for the right audience. Executives need high-level insights, while operations teams need detailed, actionable data. Role-based dashboard design ensures everyone sees what matters most.
A single source of truth is quite essential. If teams pull data from different places, trust breaks down. Business intelligence dashboards work best when everyone relies on the same, accurate data.
Standard KPI definitions across the organisation also build confidence. When everyone calculates metrics the same way, leaders and teams can make decisions without confusion.
Finally, a governed but flexible BI environment is key. Rules and controls keep data reliable, but teams still need the flexibility to explore insights. This is how business intelligence reporting becomes both trustworthy and practical.
Modern BI tools go beyond static dashboards. Real-time and near-real-time reporting helps teams see what’s happening now, so decisions can be made quickly.
Instead of just showing numbers, these tools send alerts when something needs attention. This keeps teams proactive, rather than waiting for problems to appear on a dashboard.
Embedded analytics in daily workflows makes KPIs part of the work itself. Teams don’t have to leave their systems to check reports—they get insights where they need them most.
Trend and anomaly detection highlights unusual patterns automatically. This helps teams spot issues early and act before they become bigger problems.
Dashboards only work if people trust them. Without trust, teams ignore them, rely on spreadsheets, or create shadow reports. Even the best KPI dashboards fail if users don’t believe the numbers.
Great KPIs are simple, clearly aligned with business goals, and have an owner who acts on them. Dashboards can be transformed into powerful decision tools for teams when they can understand and use KPIs. Organisations that use business intelligence analytics services often build dashboards that teams actually trust.
Success with business intelligence dashboards isn’t just about technology. It’s about behaviour, making sure people rely on the dashboard, act on insights, and make better decisions every day.